The WorkSync upgrade · main line 0-6 shipped

Tasks are not a list. They are a graph you can query.

WorkGraph treats tasks as nodes, relationships as edges and templates as the ontology. Beyond parent/child hierarchy there are dependency, blocking and reference edges - so "who is blocking whom" is no longer something people have to remember. It can be queried, drawn, and subscribed to by other systems.

8
Maximum hierarchy depth
3
Edge types: depends / blocks / references
6
Subscribable webhook events
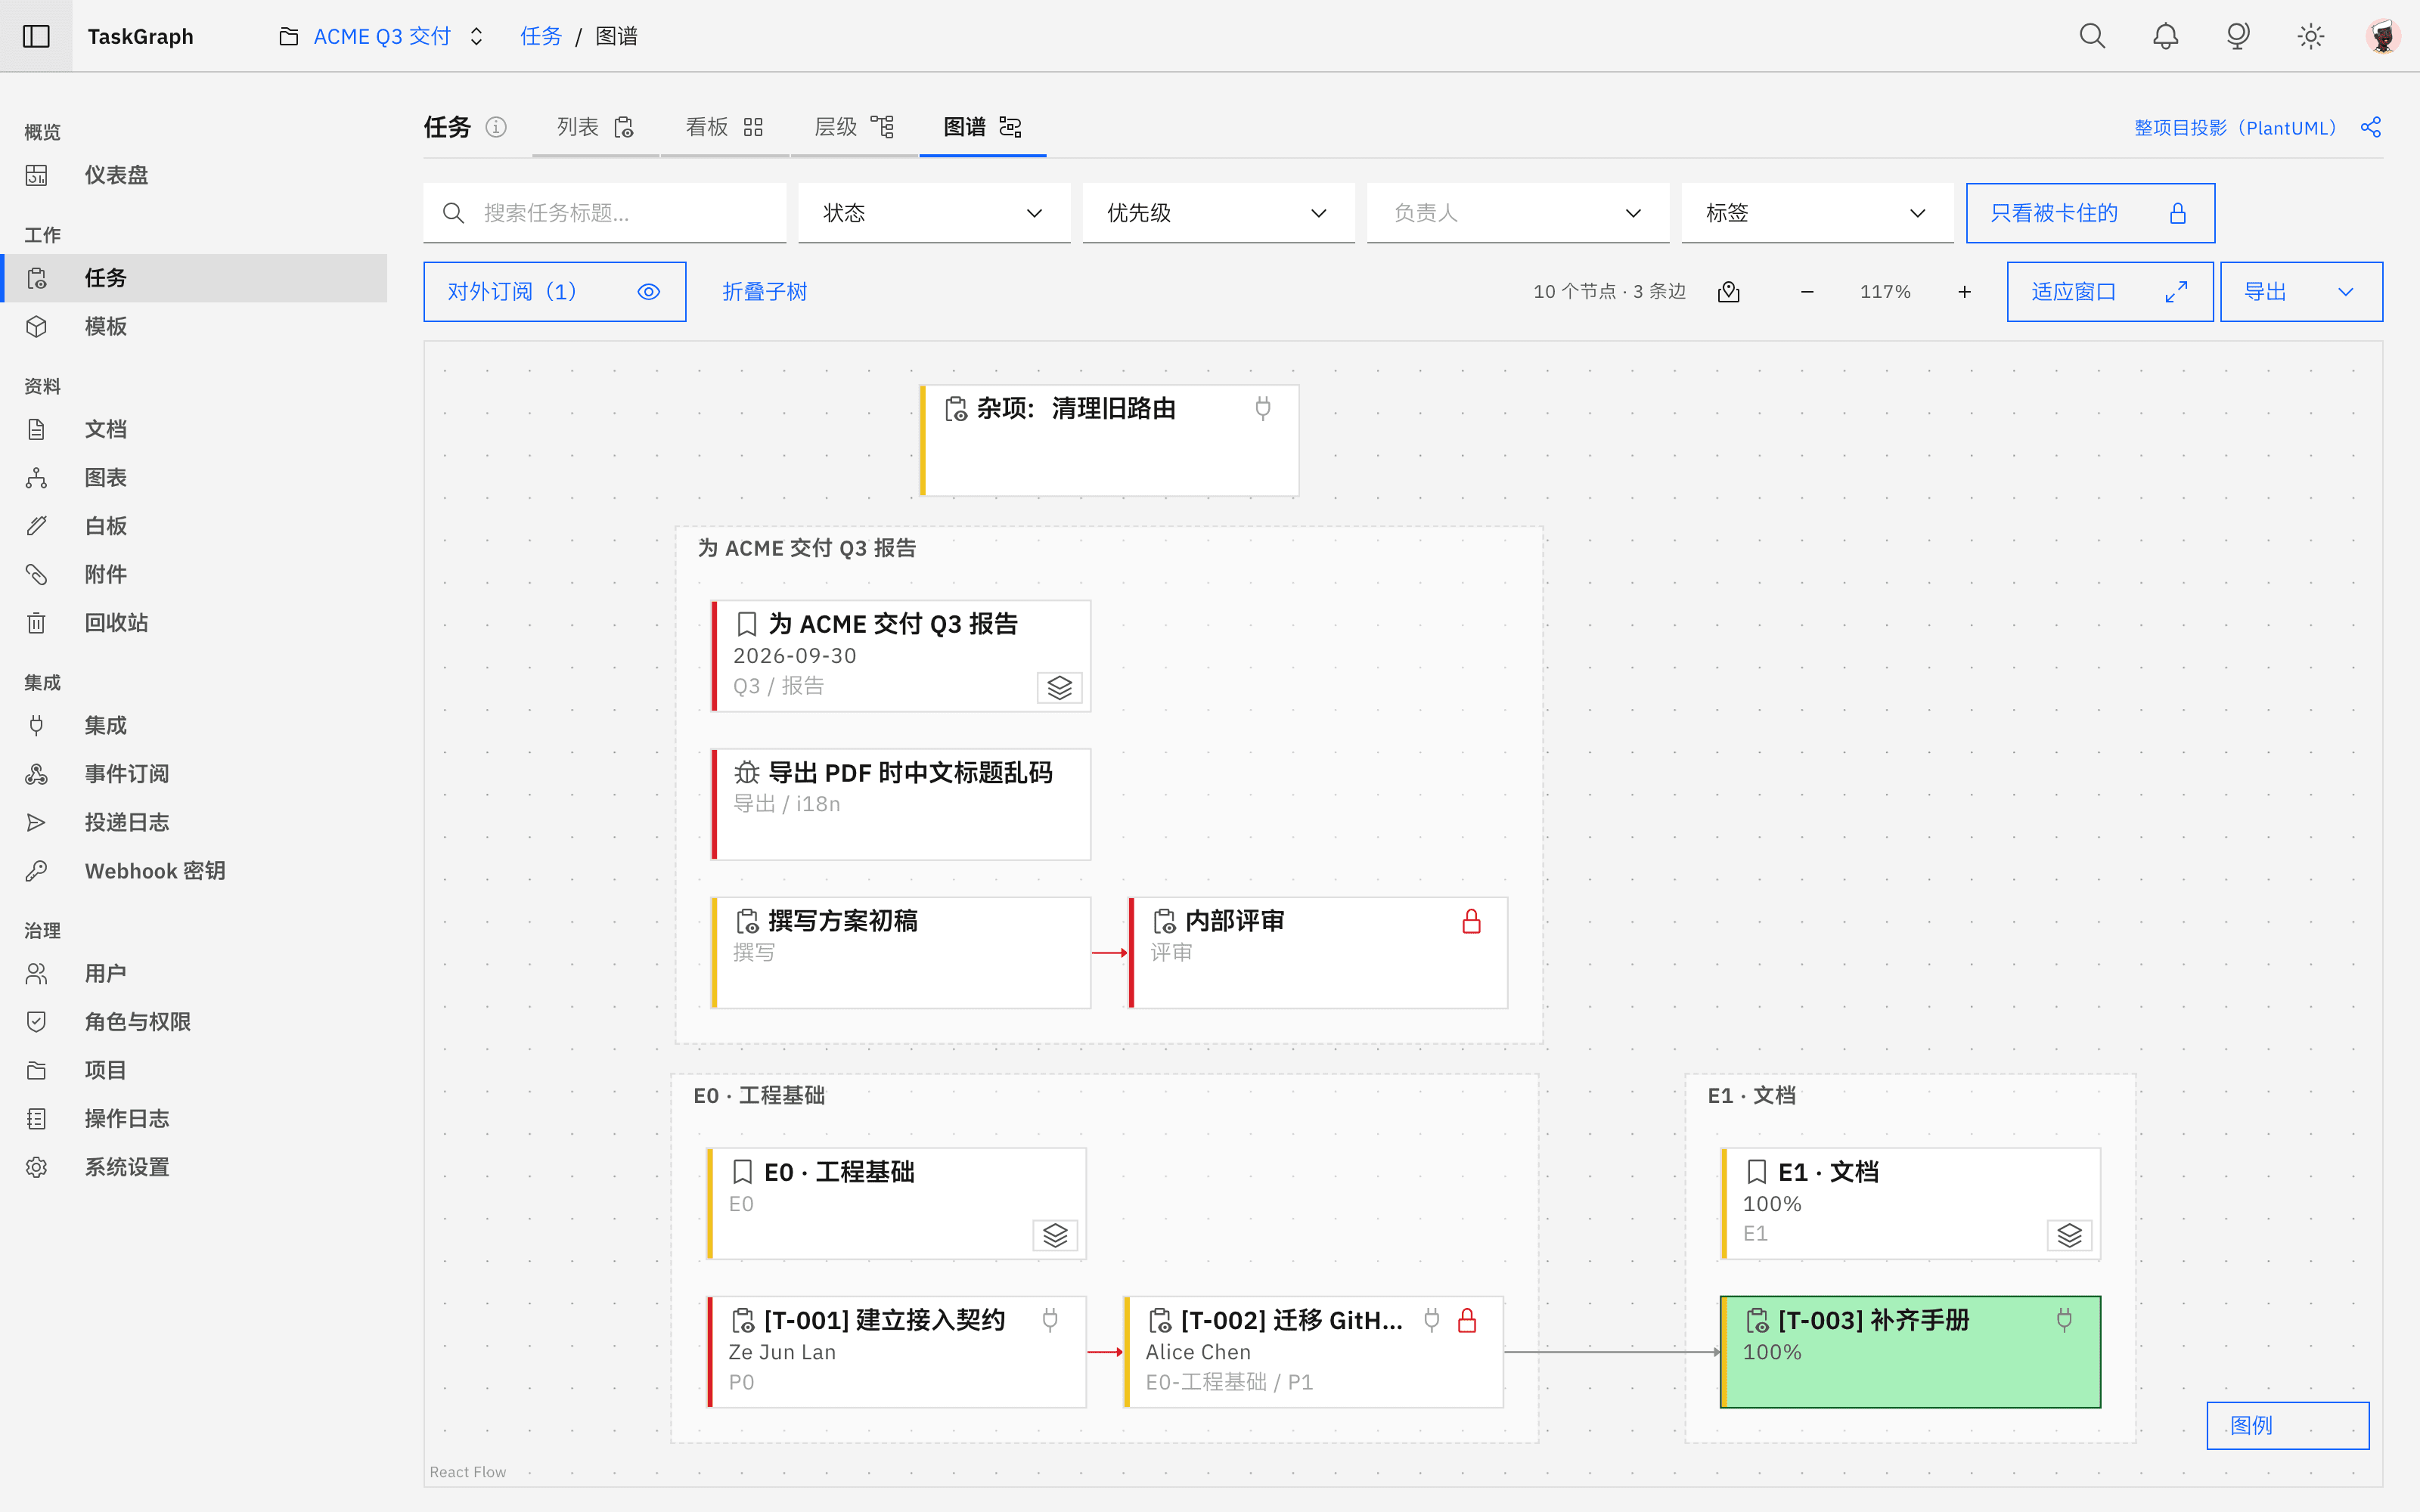
The WorkGraph task graph view
Task graph · horizontal axis is dependency order, dashed frames are hierarchy
WHAT'S DIFFERENT

Three differences from list-style tools

These are not three lines on a feature list. They are three modelling decisions, and they decide which questions the product can answer.

01 / ONTOLOGY

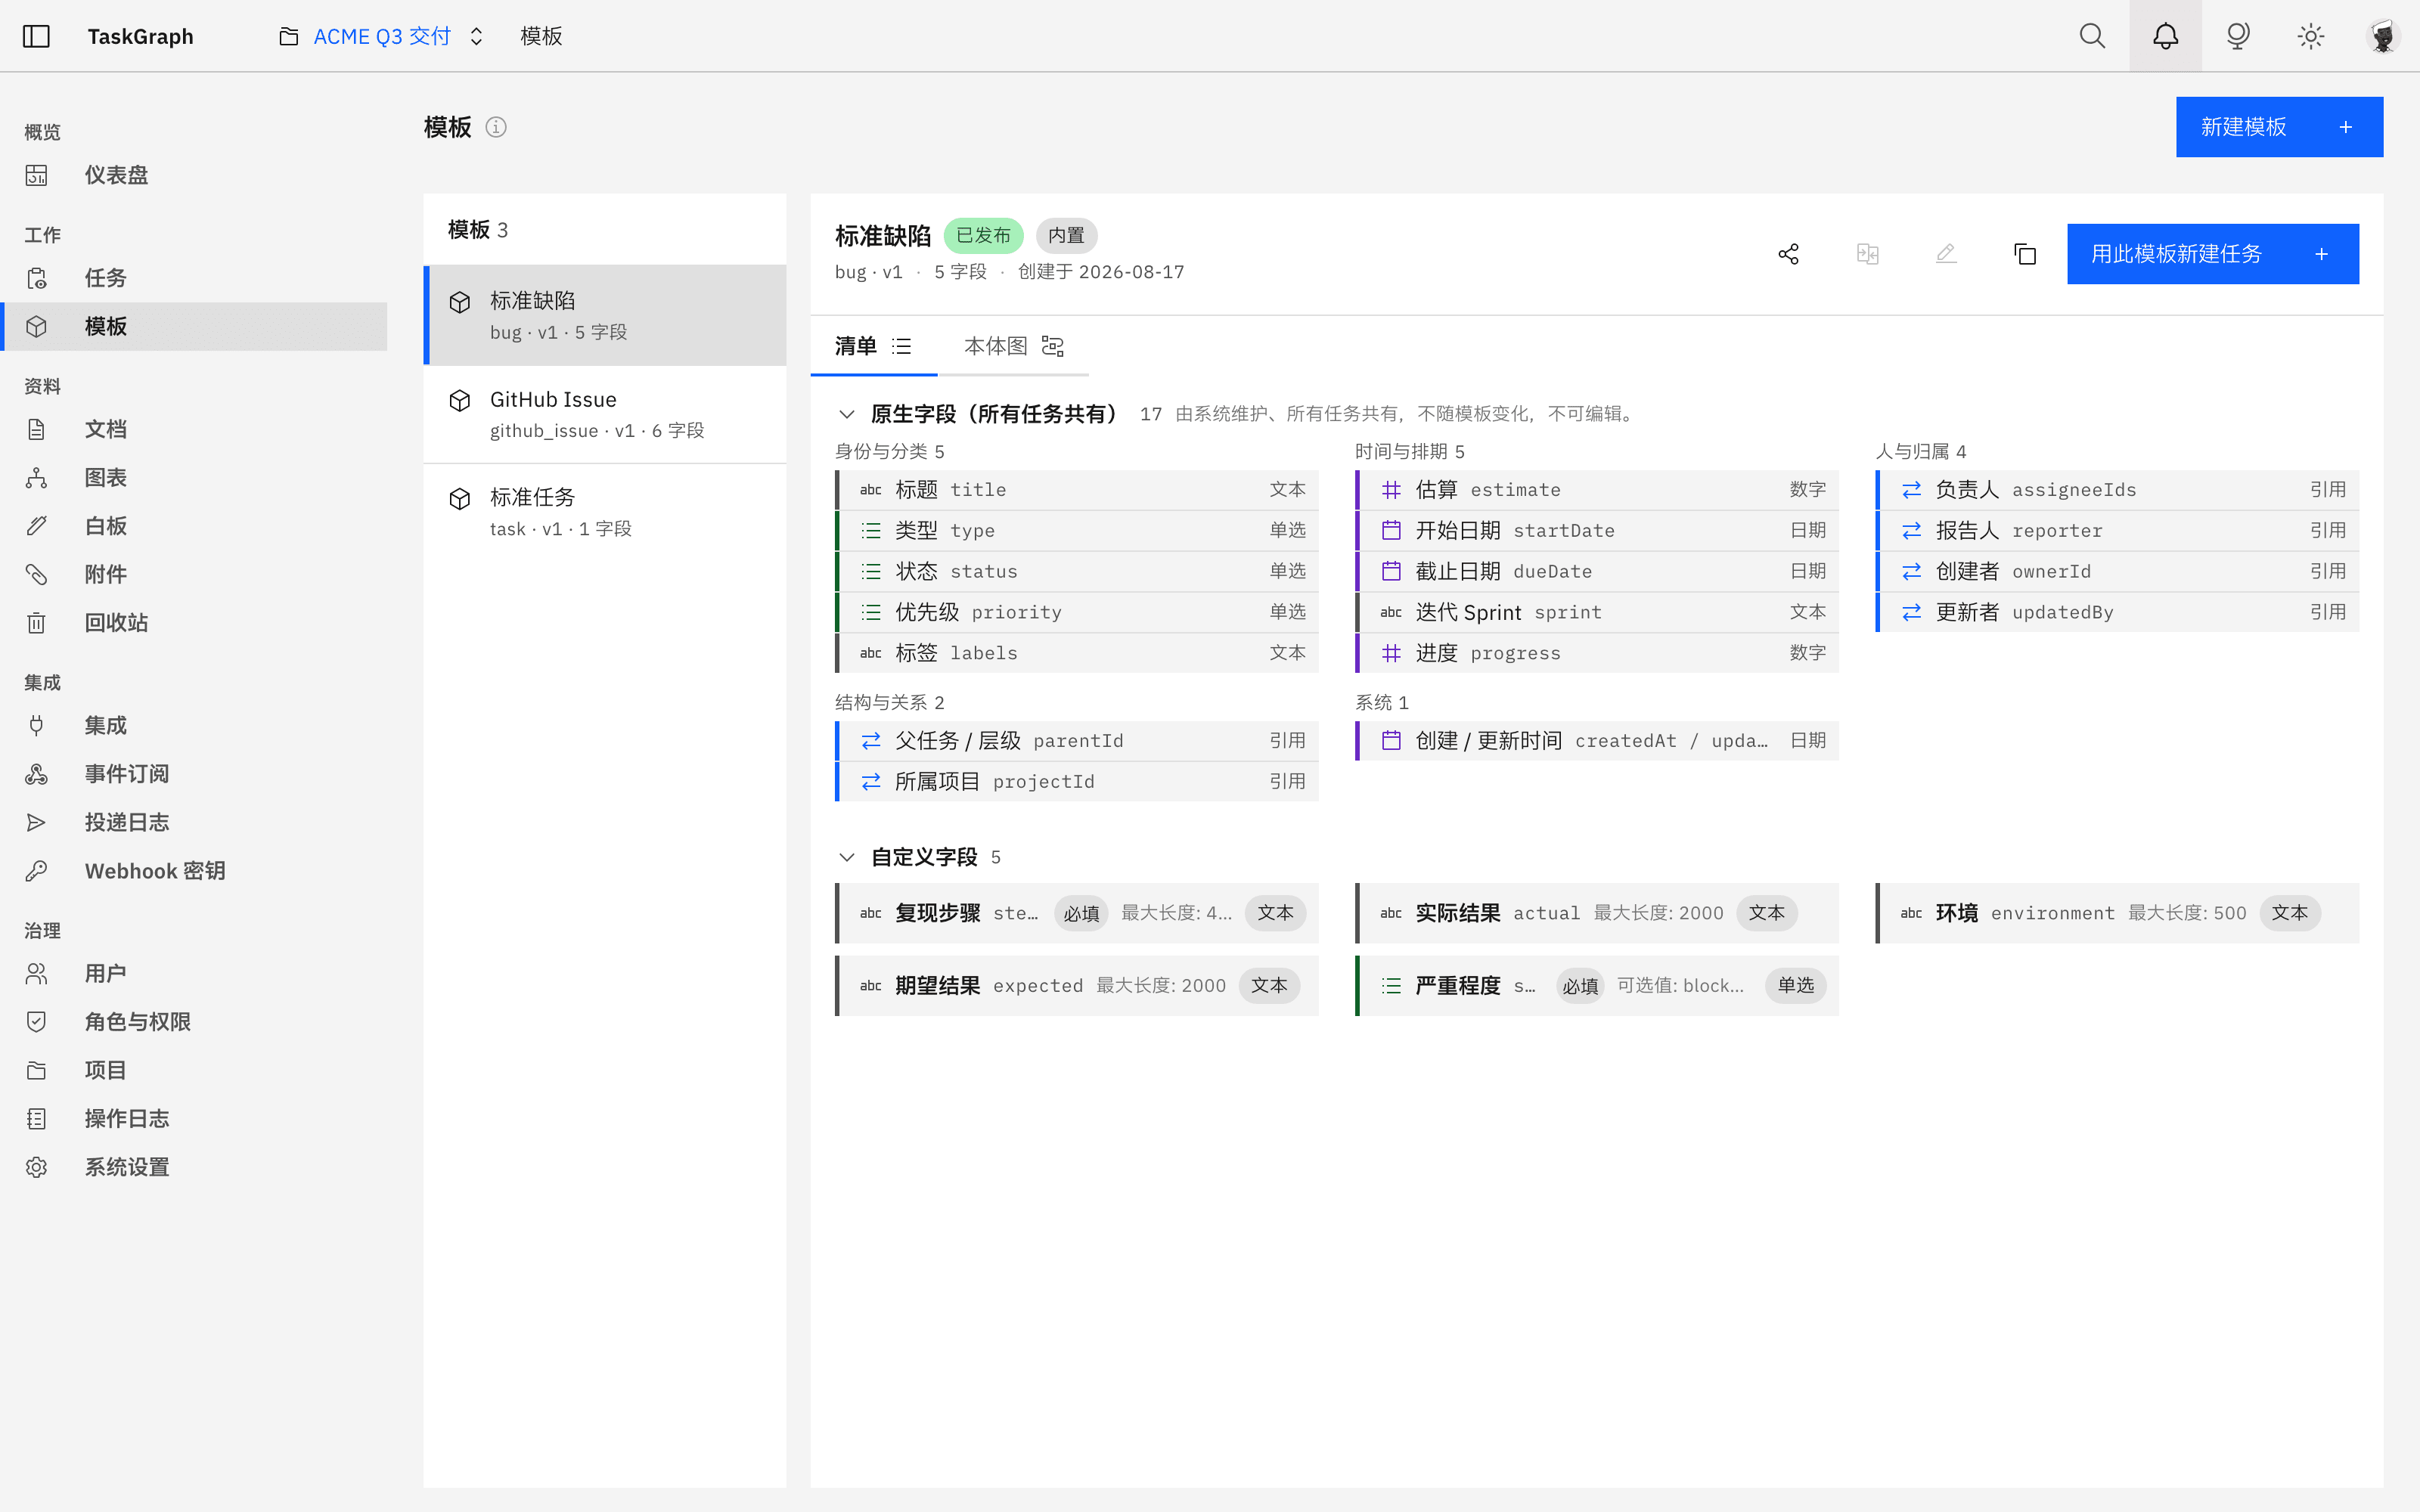
A task has an ontology, not just a title

Each kind of task (bug, requirement, review...) gets a template that defines its fields, and a task is an instance of that template. Editing a template never rewrites existing tasks - every instance remembers the version it was created from.

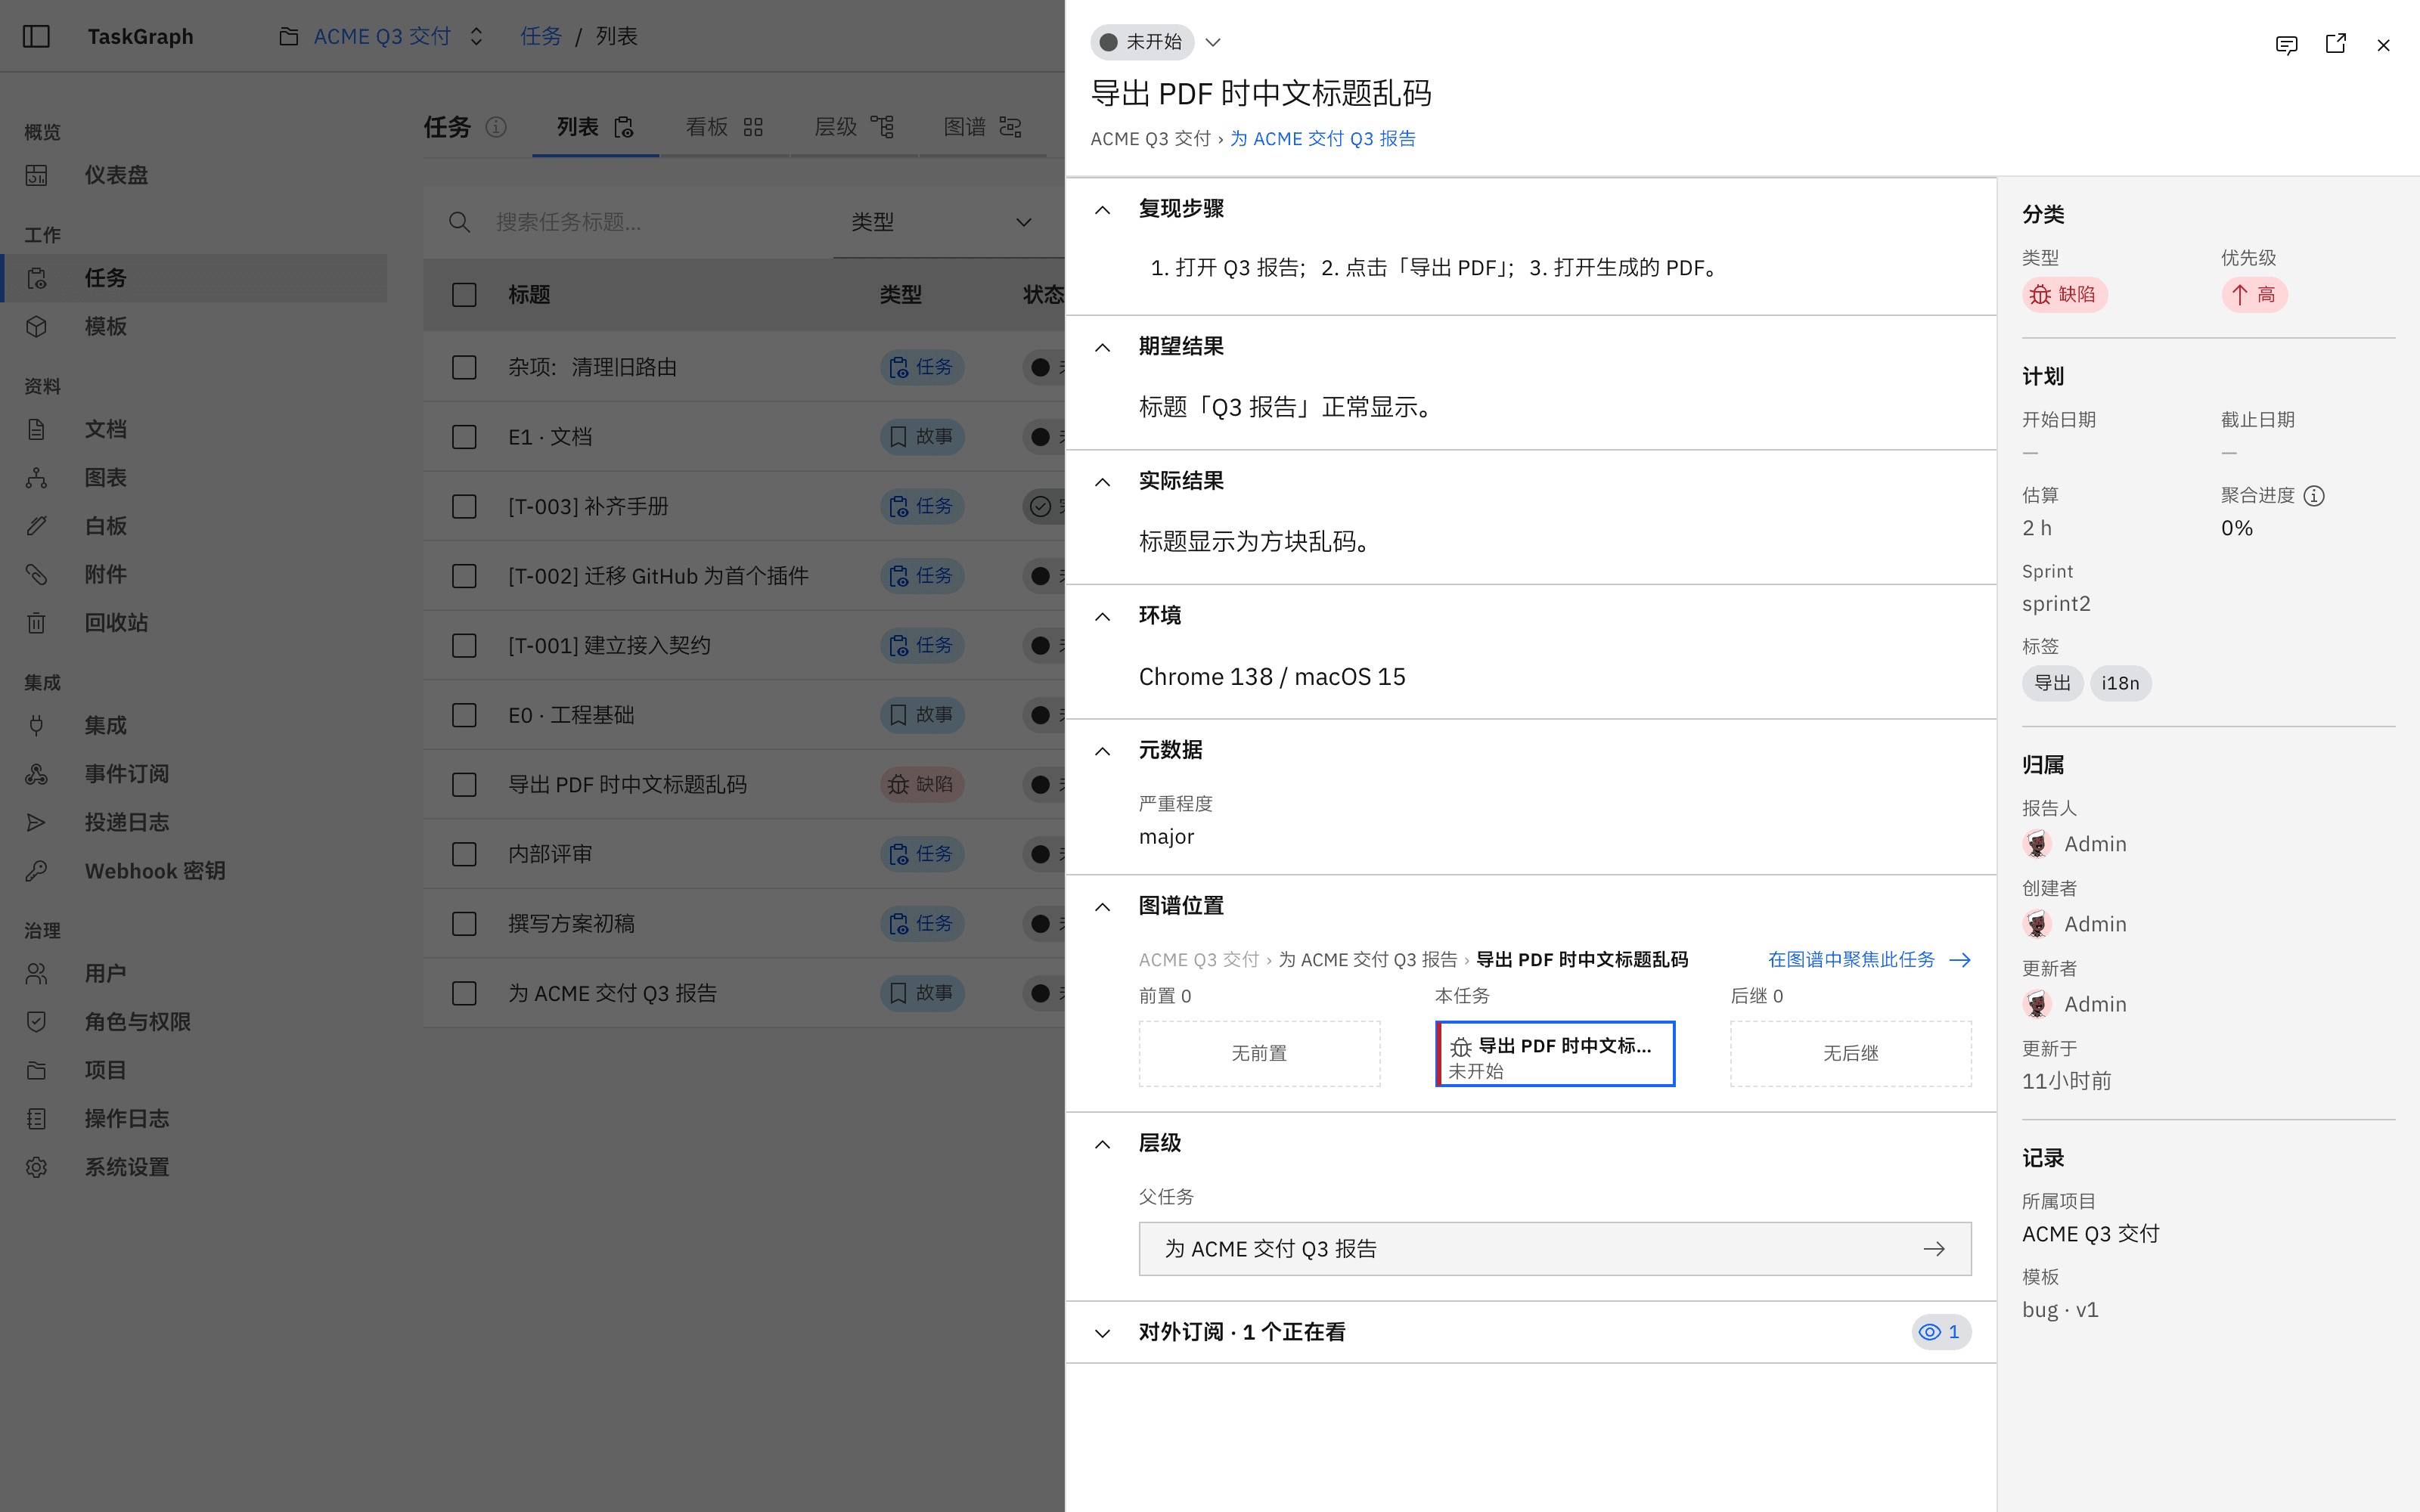
The task detail page says bug · v3
02 / GRAPH

Tasks form a graph, not a list

On top of hierarchy, tasks carry dependency, blocking and reference edges. "Who is blocking whom" becomes something you query and draw, instead of something someone recites in a standup.

Dependency order = the horizontal axis

03 / ISOLATION

A project is a hard boundary

A project you are not a member of does not exist for you: the answer is 404, not 403. Global admins are no exception - task visibility always goes through project membership, so an admin has to join first, and joining is audited.

404 instead of 403, on purpose

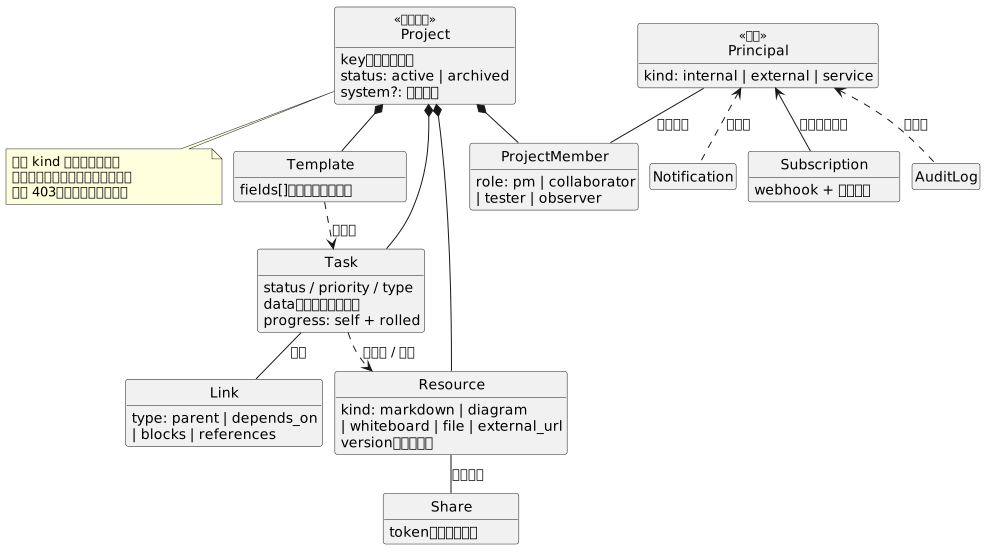
WorkGraph concept relationship diagram
Concept map · every box is a real object in the product
MAIN LINE

One main line, seven steps to a full loop

From getting in to projecting out, the product has exactly one main line. Everything else hangs off the side of it.

  1. 00

    Access

    Sign in with email and password. The project switcher in the top bar decides whose data a page lists; the sidebar is filtered by permission - entries you cannot see are not disabled, your role simply does not have them.

  2. 01

    Pick the ontology

    Choose a template before filling in a form. The template decides what the form looks like, and how this kind of task can be counted later.

  3. 02

    Create the task

    The form is generated from the template, with custom fields to cover whatever the template does not.

  4. 03

    Wire up the graph

    Attach parents (up to 8 levels, never to itself or its own descendants) and draw dependency, blocking and reference edges. This step is where the product diverges from a to-do list.

    The turning point
  5. 04

    Move it forward

    Four states: not started, in progress, done, blocked. The board is drag-and-drop, and progress rolls up as a plain average of direct children - deliberately unweighted, so when you need an exact figure you read the numbers, not the percentage.

  6. 05

    Finish

    Tasks with unfinished predecessors show a lock badge. There is no realtime co-editing, but saving does a version check, so nobody's edit is silently overwritten.

  7. 06

    Semantic projection

    Project the graph outward: webhook events and a JSON-LD read API let other systems subscribe to task changes.

Template list view
Templates as ontology · field definitions first, instances second
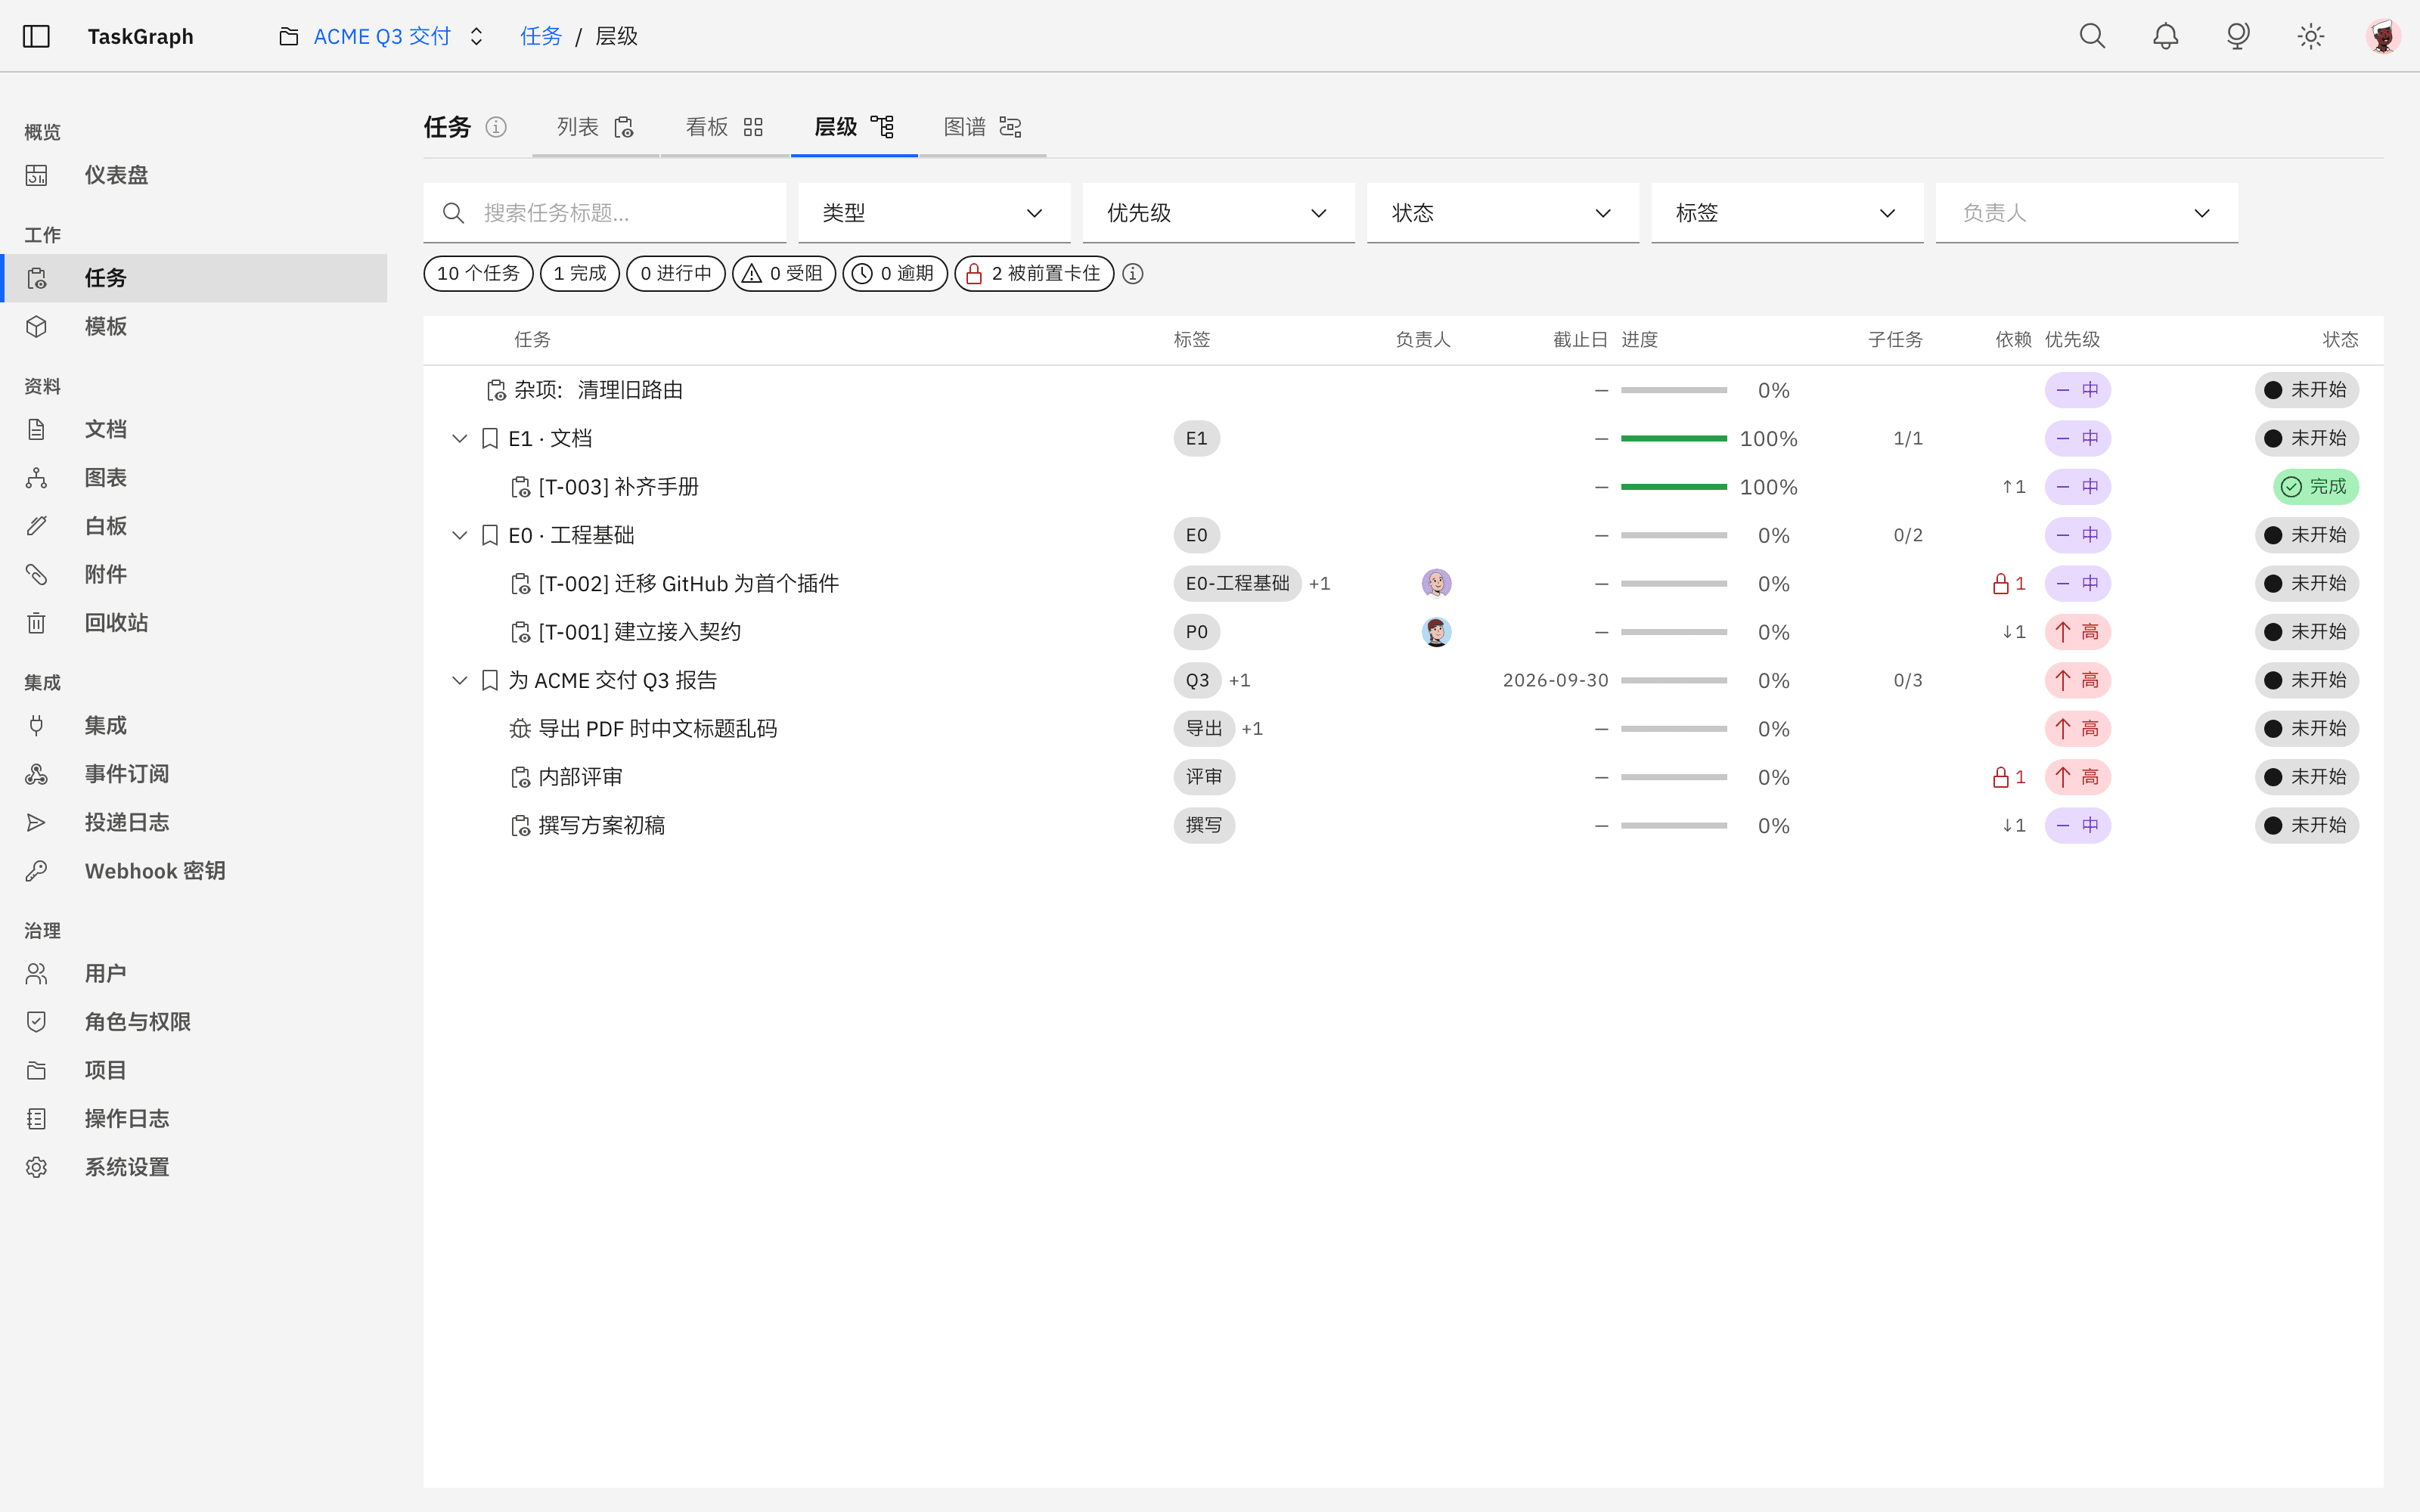
Task hierarchy tree view
Hierarchy · up to 8 levels, progress averaged over direct children
THE GRAPH VIEW

See who is blocking whom on one screen

Hand-drawn SVG with ELK layout - not an exported static picture. Horizontal is dependency order, dashed frames are hierarchy; node fill is status, the left bar is priority, the icon is type.

Legend

Grey solid arrow
Dependency
Red solid
Unfinished predecessor
Red dashed
Dependency cycle
Grey dashed
Reference
Bold
Aggregated edge across a collapsed subtree
Blue bold
Hover highlight of the whole transitive chain

Hard limits, stated up front

500
Task fetch cap, with a banner when exceeded
150
Above this, one subtree layer auto-collapses
0.2-2.5x
Zoom range; the minimap turns on above 40 nodes
Task graph peek drawer
Click a node for a peek drawer · the thumbnail lists predecessors | this task | successors, up to four each

Four things it does differently

Filtering never deletes nodes

Non-matching nodes fade instead of disappearing, and the corner shows "X of Y matched". You always know which part of the whole you are looking at.

A screen you can send as-is

Focus mode keeps ancestors, descendants and transitive dependencies; filter, focus and collapse state all live in the URL query, so a colleague opens exactly the screen you were looking at.

Four export outlets

Download SVG, download PNG at 2x, copy the PlantUML source, or save it as a project diagram. The first three happen entirely in the browser - the graph never leaves it.

Keyboard and screen readers work

Tab and Enter navigate; clicking a node opens a peek drawer. A plain-text list of nodes and dependencies ships alongside, so a screen reader never has to chew through the SVG.

ONE MECHANISM

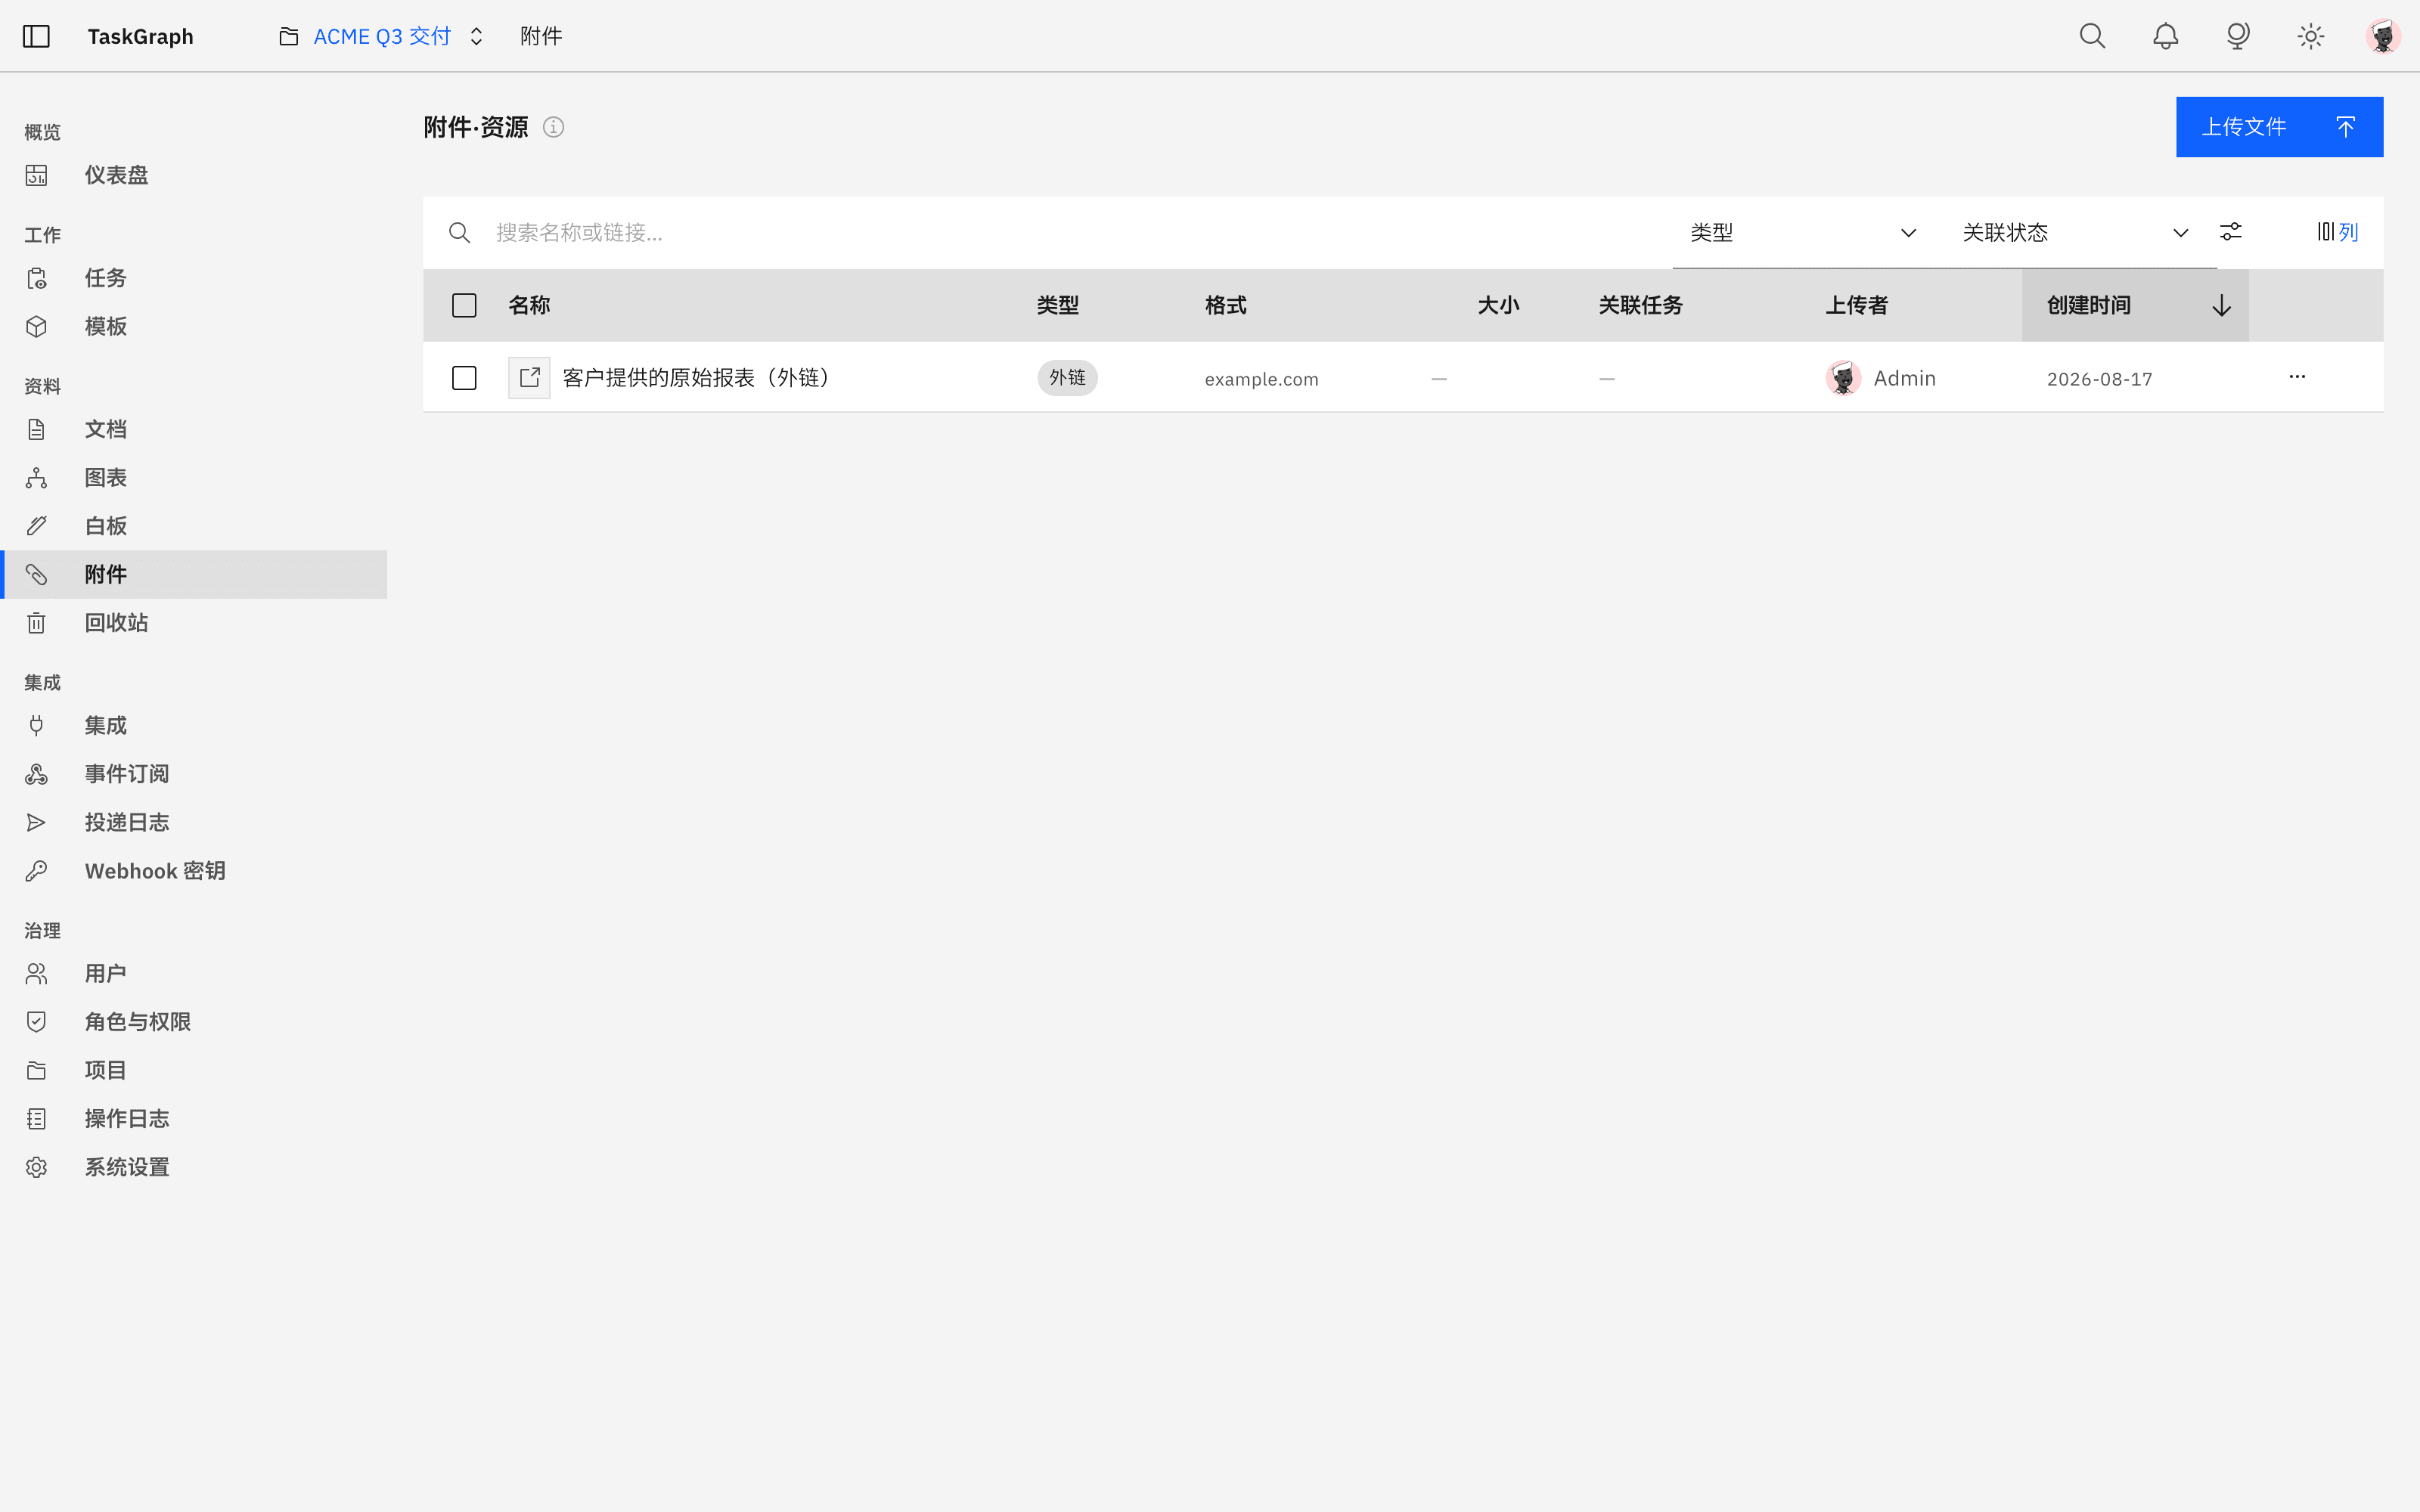
Docs, diagrams, whiteboards, attachments and links are five kinds of one object

The five modules you know from WorkSync are five kinds of a single resource mechanism here: one permission model, one trash, one way to share. Not five subsystems each solving it again.

markdown

Document library

A tree up to 5 levels deep, autosaving about every 2 seconds. Full version history: line-level diff, preview, tagging and rollback, with history append-only. Cross-document links resolve by id, so renaming never breaks them.

diagram

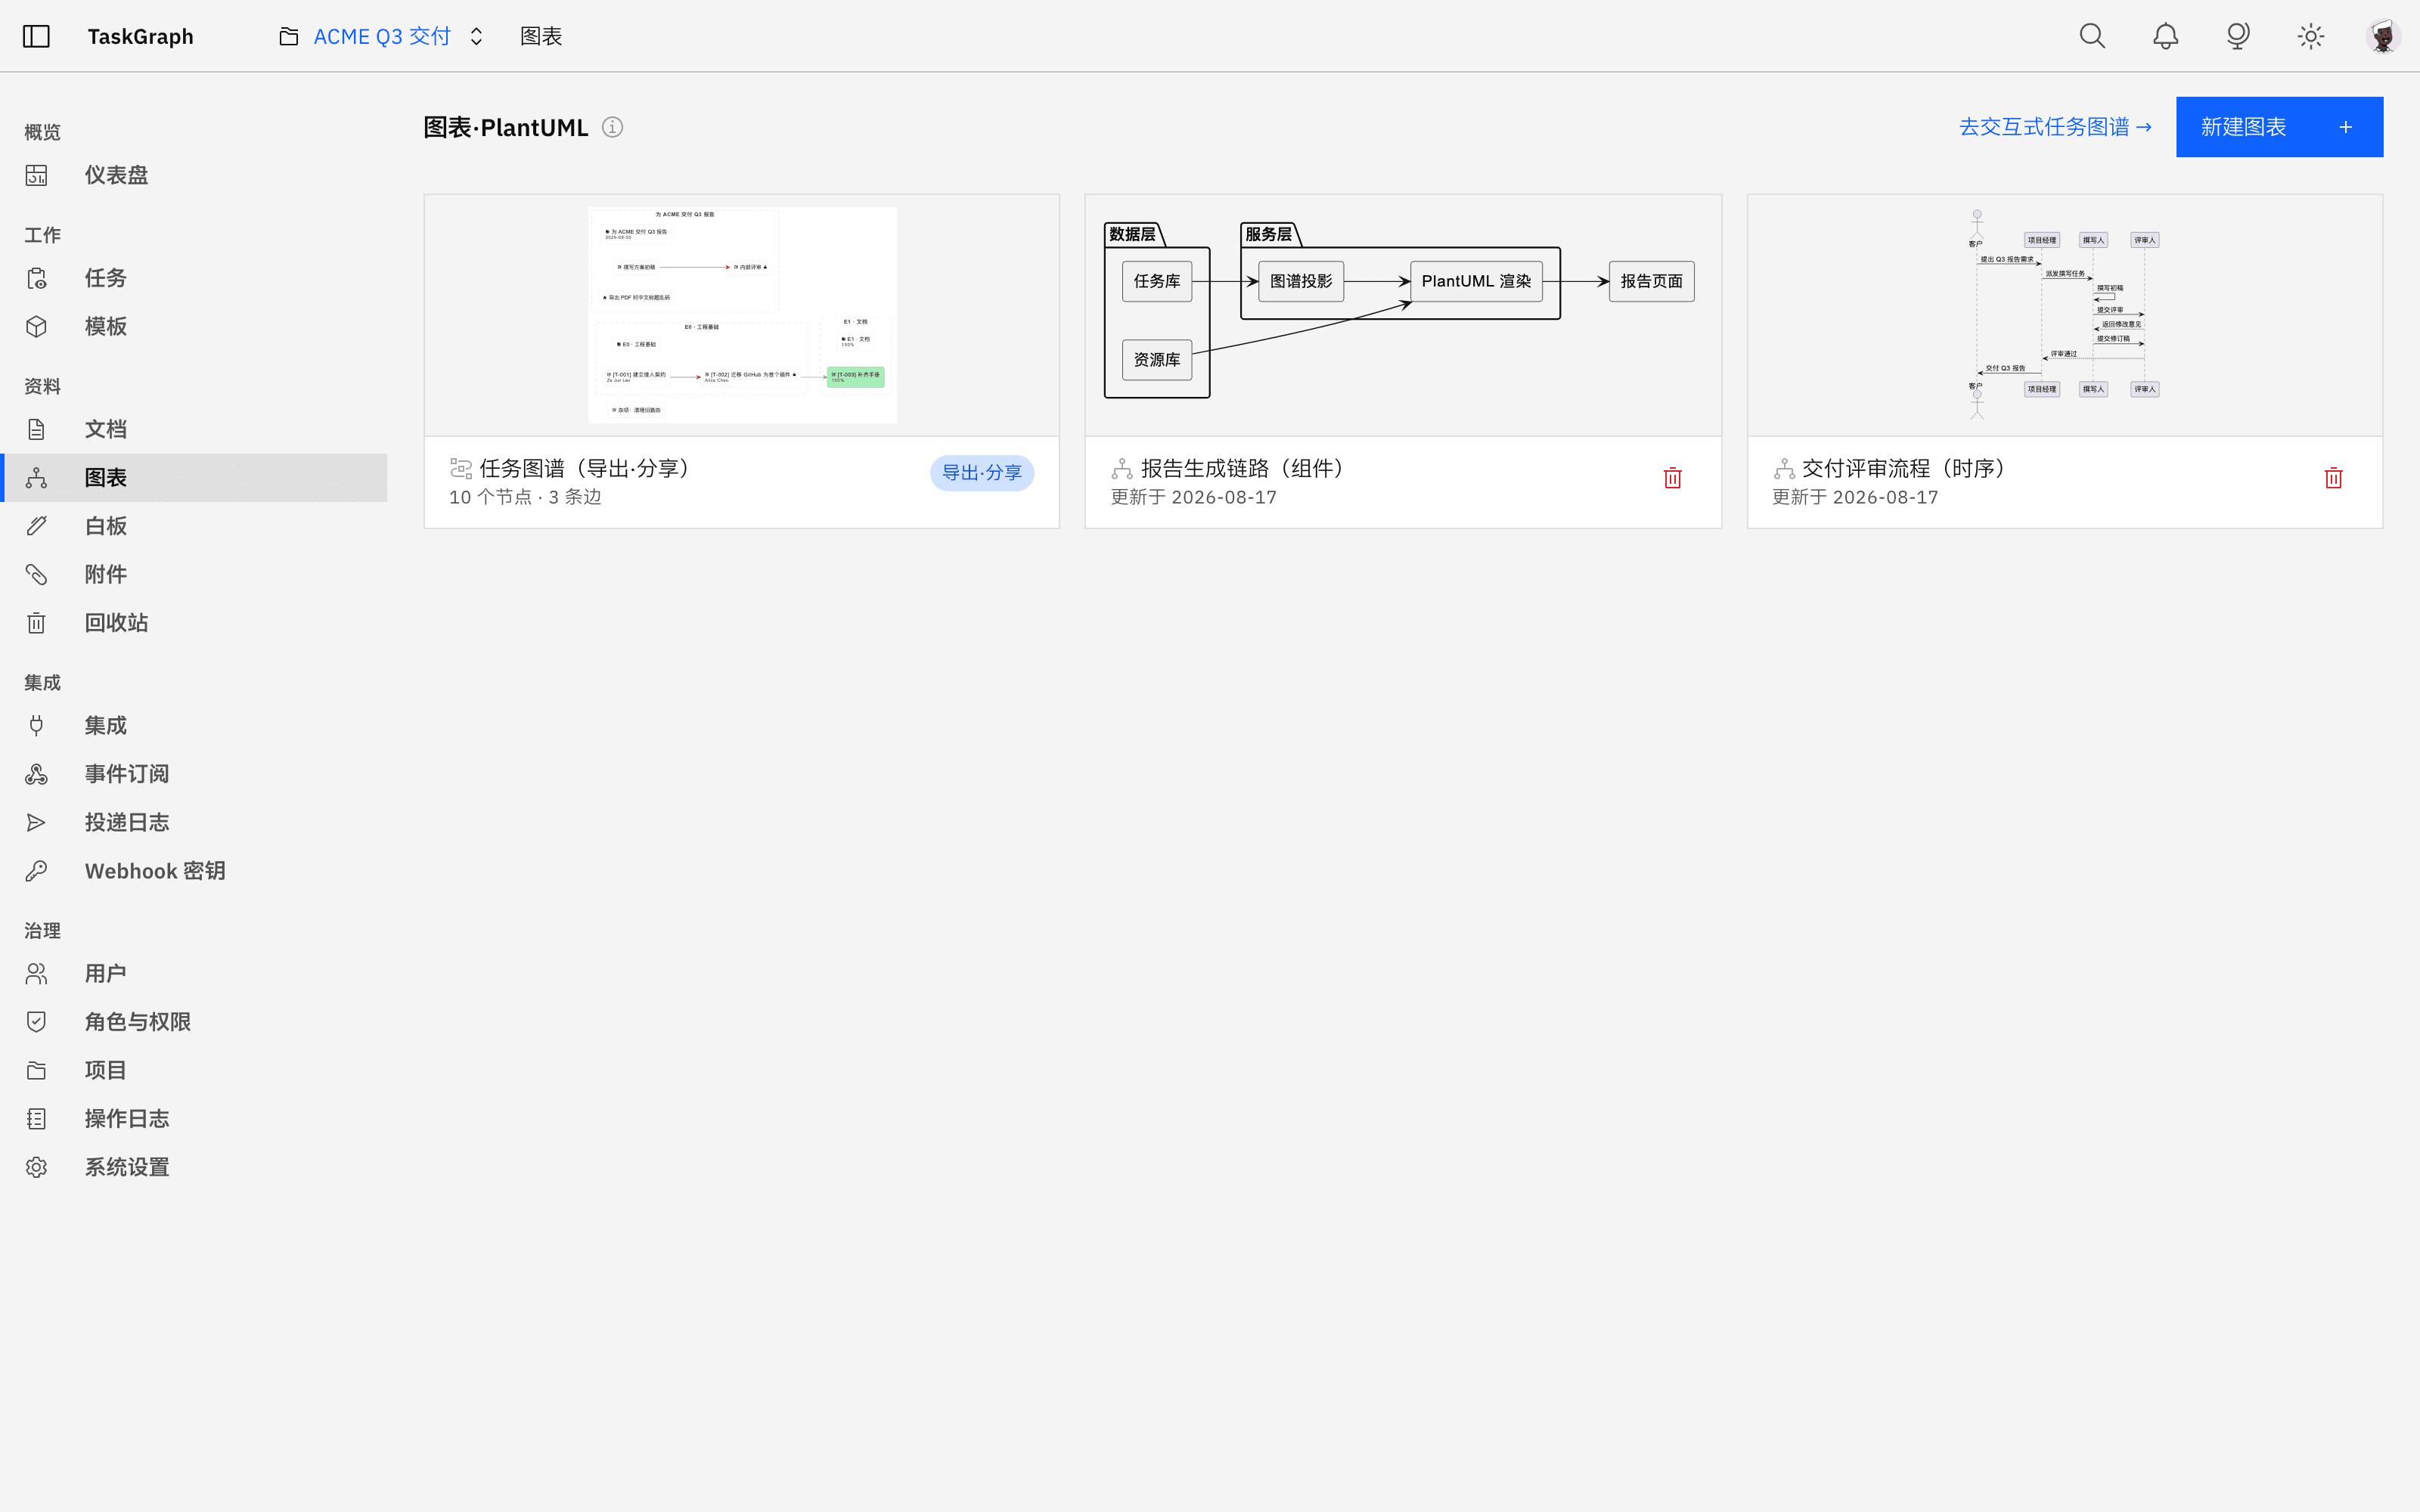
Diagrams (PlantUML)

Rendering goes through a self-hosted PlantUML server, so source never appears in a URL, a Referer header or a proxy log. 100k character cap; syntax errors come back as an annotated error image. The project's task relationship diagram is generated automatically.

whiteboard

Whiteboard

An Excalidraw canvas that autosaves, storing the canvas, background and grid only. Paste accepts bitmaps only - SVG carries a script-injection risk, so it is refused. 3MB canvas cap.

file

Attachments

50MB by default, 1-500MB by platform policy. Virus scanning fails closed: if the scanner is unconfigured, unreachable or times out, the upload is rejected rather than waved through.

External links

external_url

Off-site material is registered as a resource, so it attaches to tasks, goes to trash and gets shared like everything else.

Resource library view
Resources · one object, five kinds
PlantUML diagram view
Diagrams · rendered server-side, source stays out of the URL
GOVERNANCE

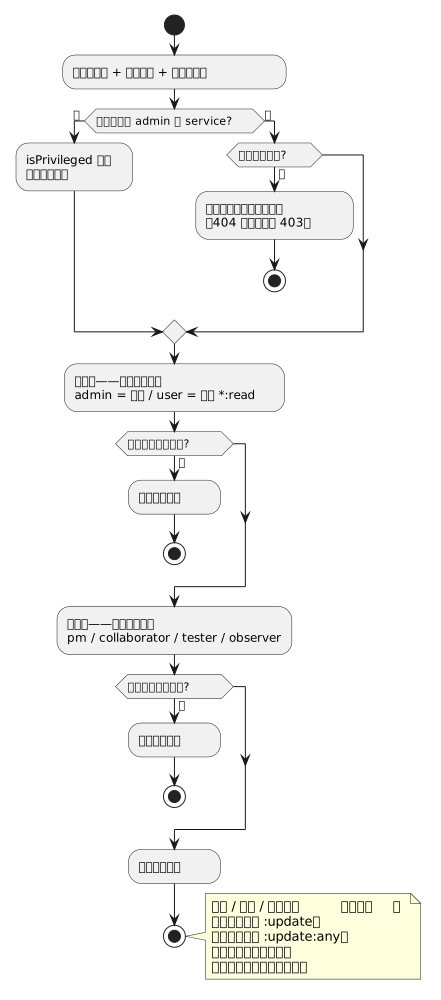
Permission is two layers multiplied

The global role (admin / user) decides which pages you can open; the project role (PM / collaborator / tester / observer) decides which tasks you can touch. The two multiply, and any role the system cannot resolve falls back to least privilege.

Two-layer role model diagram
Global role x project role · multiplied, not added

Admin does not mean read-everything

Governance pages - users, logs, the project list - belong to admins; project content still goes through membership. There is no back door into a project they have not joined, and joining is itself an audited event.

The audit log records only what matters

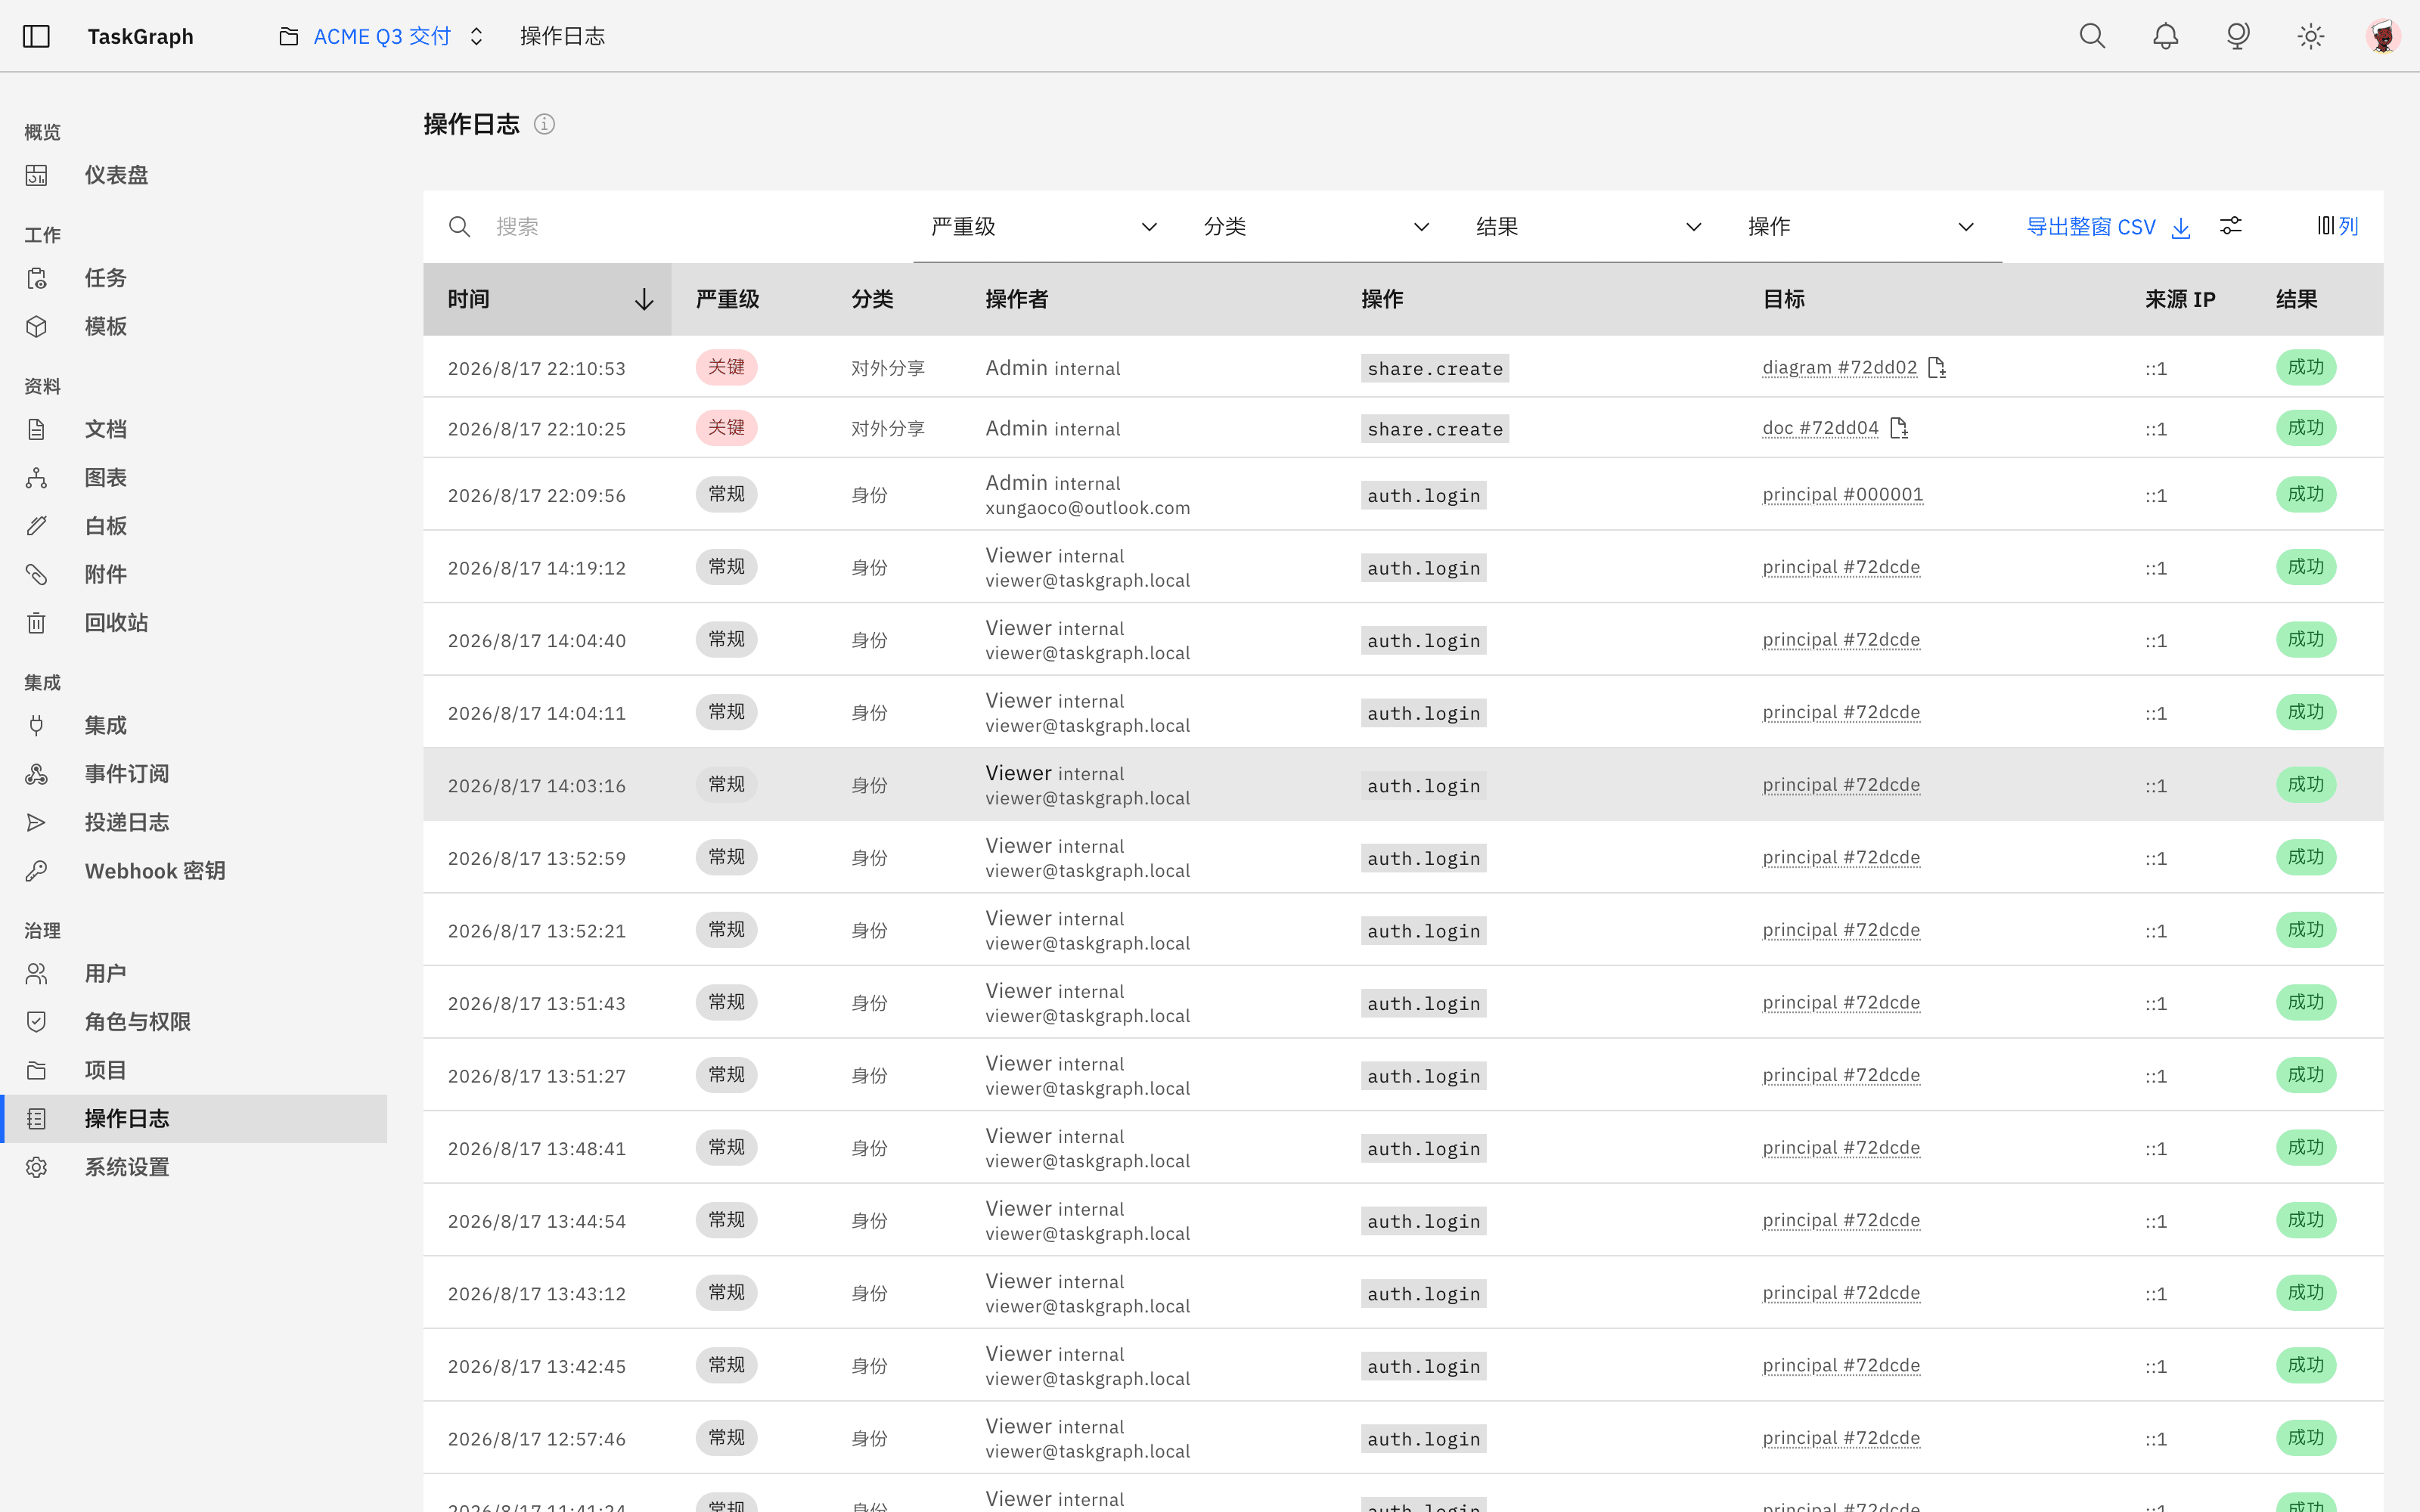
Five whitelisted categories: authorization, sharing, destructive actions, auth and credentials, configuration changes - plus every denied action, highlighted. Ordinary field edits go to the object's own activity feed instead. The audit log has no TTL.

One account, one session

The newest sign-in wins. Force-logout is not an instant disconnect and does not change the password; to actually stop someone, disable the account. Accounts are never deleted - delete one and "who did this" in the audit log points at nothing.

Two fates in the trash

Docs, diagrams, whiteboards, attachments and links are soft-deleted for 30 days. Tasks are deleted immediately and irreversibly, guarded by "a task with children cannot be deleted directly". Share links die on delete and do not come back on restore.

Audit log view
Audit log · five whitelisted categories, denied actions highlighted
SEMANTIC PROJECTION

Other systems can subscribe to this graph

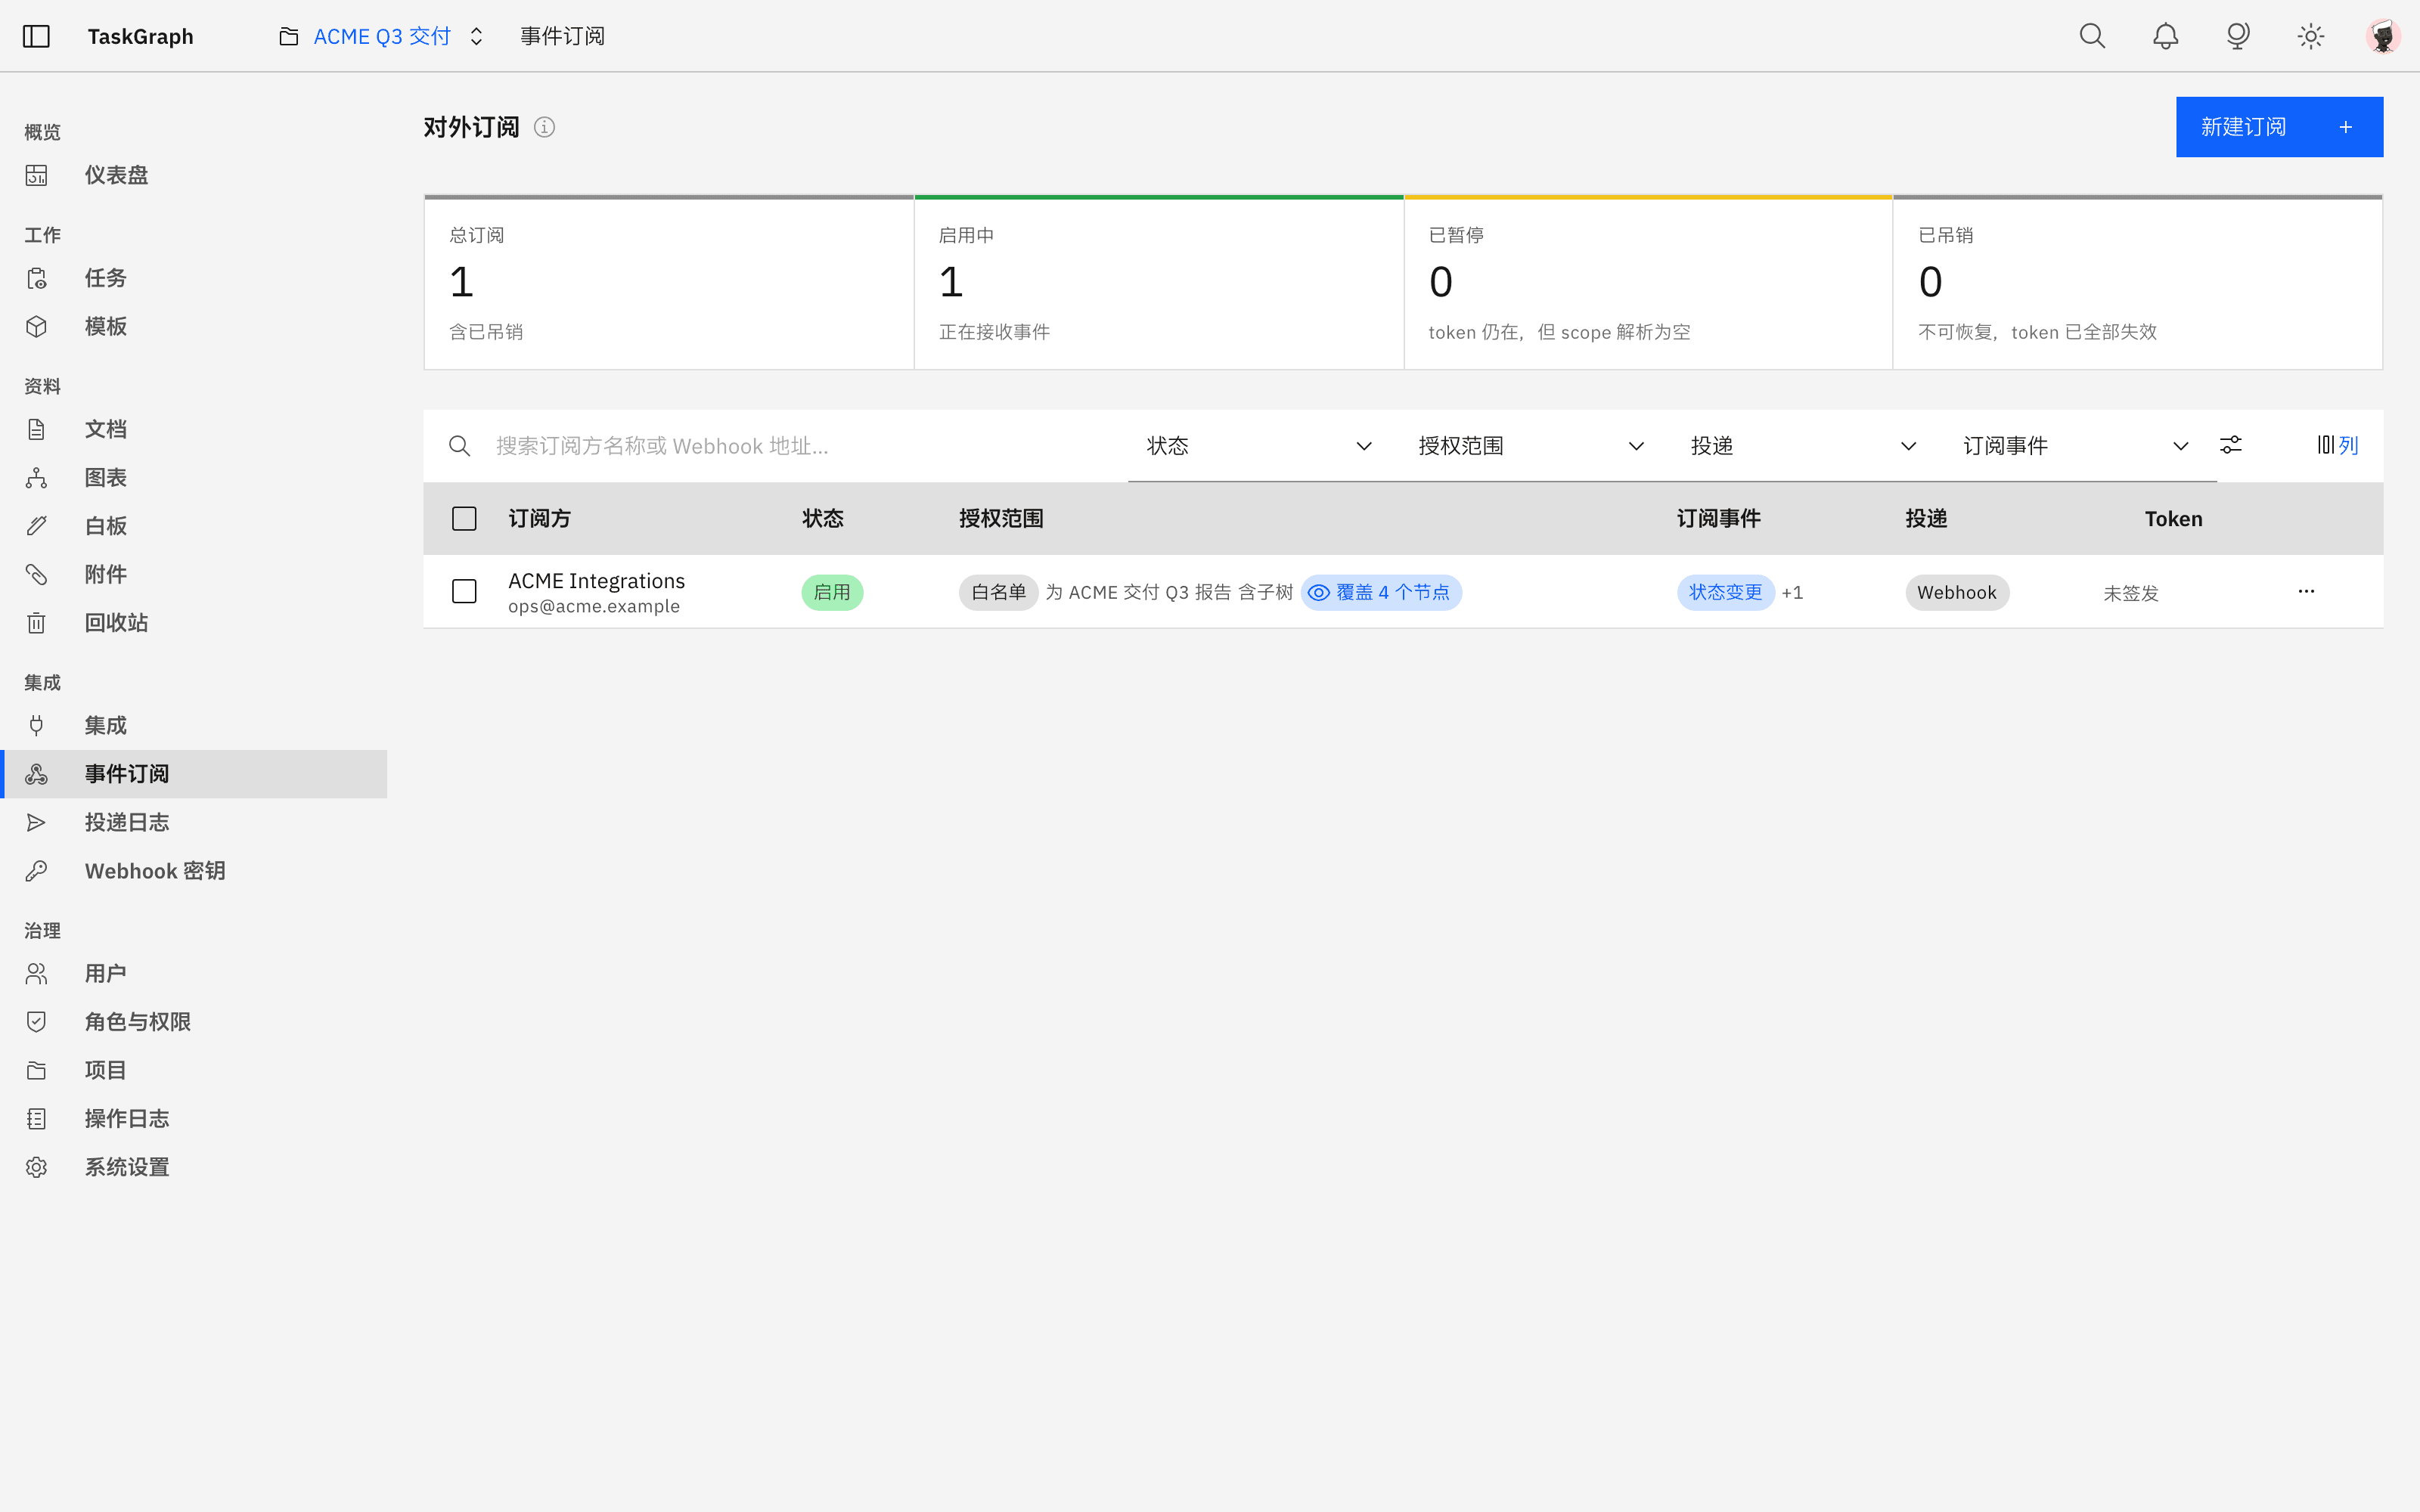
External access happens through an external principal, not a bare API key - and it is bound by the same project membership. Scopes: specific tasks, the project root task, or assigned to me.

Delivery headers

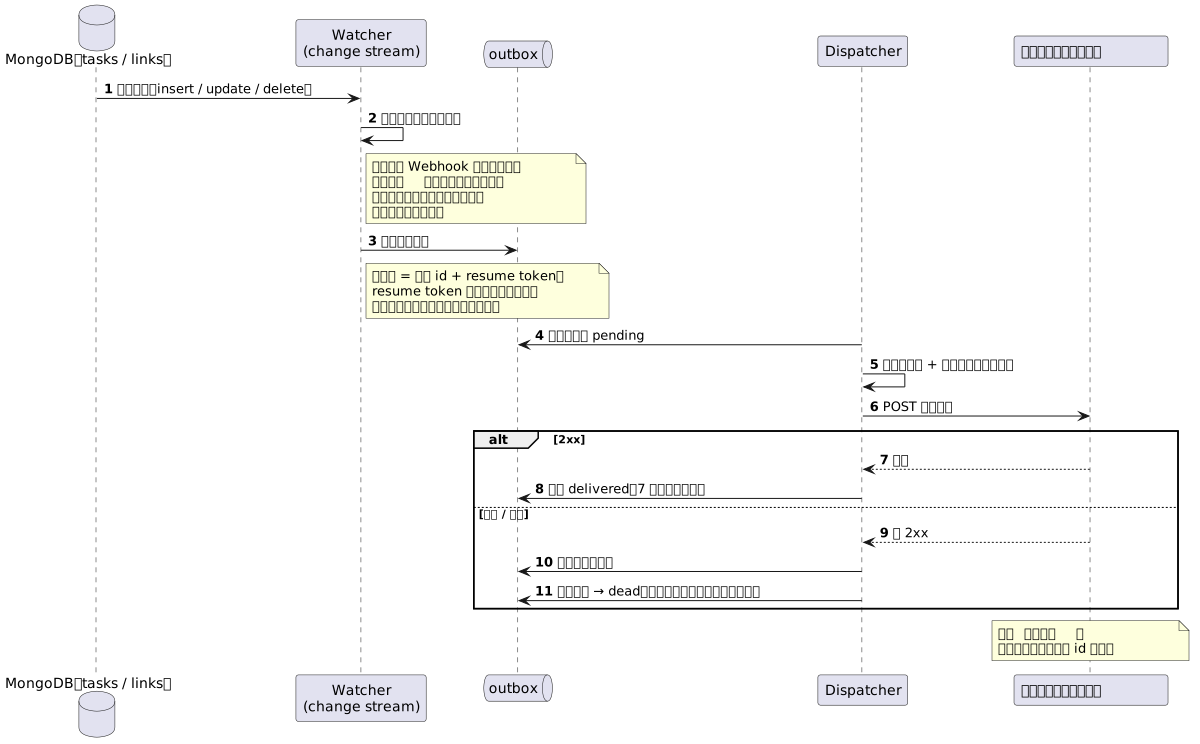
X-TaskGraph-Signature: sha256=HMAC-SHA256(secret, raw body)X-TaskGraph-Delivery: id of this delivery

WorkGraph is the product name; the repository, the CLI and the delivery headers all identify it as TaskGraph. Integrate against the header names above verbatim.

A token is shown in full exactly once at issue time; after that only an 8-character fingerprint remains. Issuing one is a critical audit event.

Subscription management view
Subscriptions · external principals, scopes, token fingerprints and delivery health
EVENTS

Six event types

task.created / task.updated / task.status_changed / task.deleted, plus link.created / link.deleted. Both task and relationship changes are covered.

SIGNING

Verify raw bytes, dedupe by id

Consumers must verify the signature against the raw request body and dedupe on the payload id - global ordering is not promised, and duplicate deliveries are allowed by design.

RETRIES

A backoff ladder in the open

1 minute, 5 minutes, 30 minutes, 2 hours, 6 hours - then the delivery is dead-lettered. The delivery log carries the failure reason.

READ API

JSON-LD semantic projection

Two read-only endpoints: task list and task detail. Ask for JSON-LD in the Accept header and you get the semantic projection, with Vary: Accept on the response. Read only for now - there is no external write API.

IMPORT

One plugin per platform

GitHub is built in. Online and offline import share the same mapping and idempotency code, so results match field by field; re-running is safe, and "created 0 / skipped 48" is a success. One-way and read-only: changes here never flow back upstream.

Subscription and delivery flow diagram
Subscribe, event, signed delivery, retry
DEPLOYMENT

Runs on your own machines

The main line 0-6 is complete and running on real projects. One compose file brings up the whole stack, and data, diagram sources and files never leave your network.

One compose file, the whole stack

Six services: the app, a single-instance worker, a MongoDB 7 replica set, object storage, upload virus scanning and PlantUML rendering. Only the app container is published - the other four are reachable on the stack network alone.

No aggregation on the read path

P95 internal queries stay under 200ms: every compound index leads with projectId, ancestry is a materialised path, and progress is computed on write. Reads happen in server components, so the client has no requests to cache.

Diagram sources and file bytes stay inside

PlantUML is self-hosted with its sandbox profile pinned. Object storage issues no presigned URLs - file bytes are proxied by the app, so it has no reason to be reachable from outside. The build makes no outbound calls either, and telemetry is off.

Upgrades are two idempotent steps

First collections, validators and indexes, then the built-in manual - both steps are idempotent, so re-running them on upgrade writes nothing twice. Mail settings bump a version counter and take effect hot, so the worker never restarts.

WORKGRAPH

Want to see it on your own schedule?

Book 30 minutes: bring a real slice of your plan, we draw its dependencies and hierarchy as a graph, and you see on the spot which chain is stuck. Teams already on WorkSync can use the same call to talk through migration.

Back to WorkSync

We reply within one business day

WorkGraph - Task Graph Collaboration (the WorkSync upgrade)